Dashboards
Create and manage custom dashboards in Docusnap365.
2 minute read
The Boards in Docusnap365 offer a central way to bring together information from different areas and present it clearly.
This ensures you always have the most important information in view and can respond to problems before they become critical.
Key figures, anomalies, and trends can be identified immediately – without having to switch between individual modules.
Dashboards
A predefined dashboard is initially provided by Docusnap365. This can be customized and extended with additional widgets. You can also create your own dashboards to represent specific priorities for your company.
Topic Boards
In addition to dashboards, there are other overarching areas that act as collections of multiple specific boards:
These areas group several boards with the same thematic focus. This allows you to switch between different views, such as servers vs. clients, without losing context.
Widgets are the building blocks of the boards. They display key metrics, status information, or alerts, for example when risks or anomalies exist.
Examples:
Widgets can be individually configured, for example by adjusting thresholds or categories.
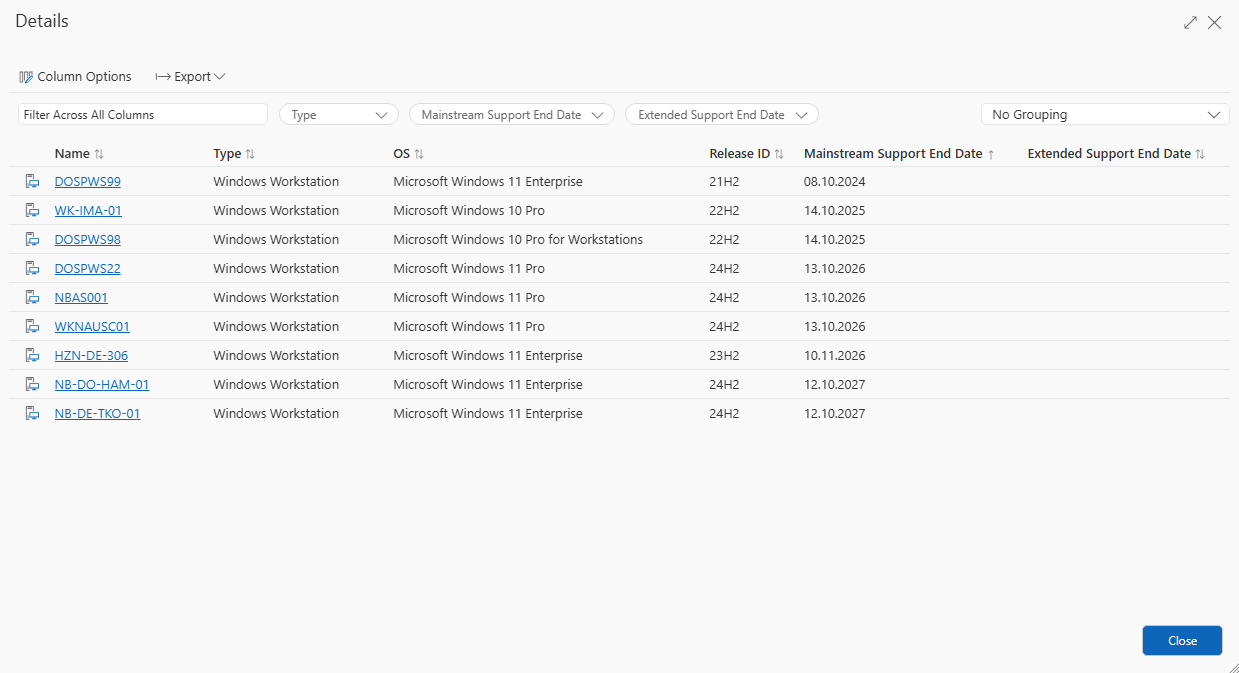
A widget not only shows aggregated metrics but also allows drill-down into the underlying data.
Create and manage custom dashboards in Docusnap365.
The Systems boards provide a quick overview of the status of your operating systems.
The Data Quality board shows how current and complete your inventory data is.
The Security & Compliance boards show security-relevant settings and risks for your systems.
The Hardware boards provide a quick overview of the status and equipment of your IT hardware.