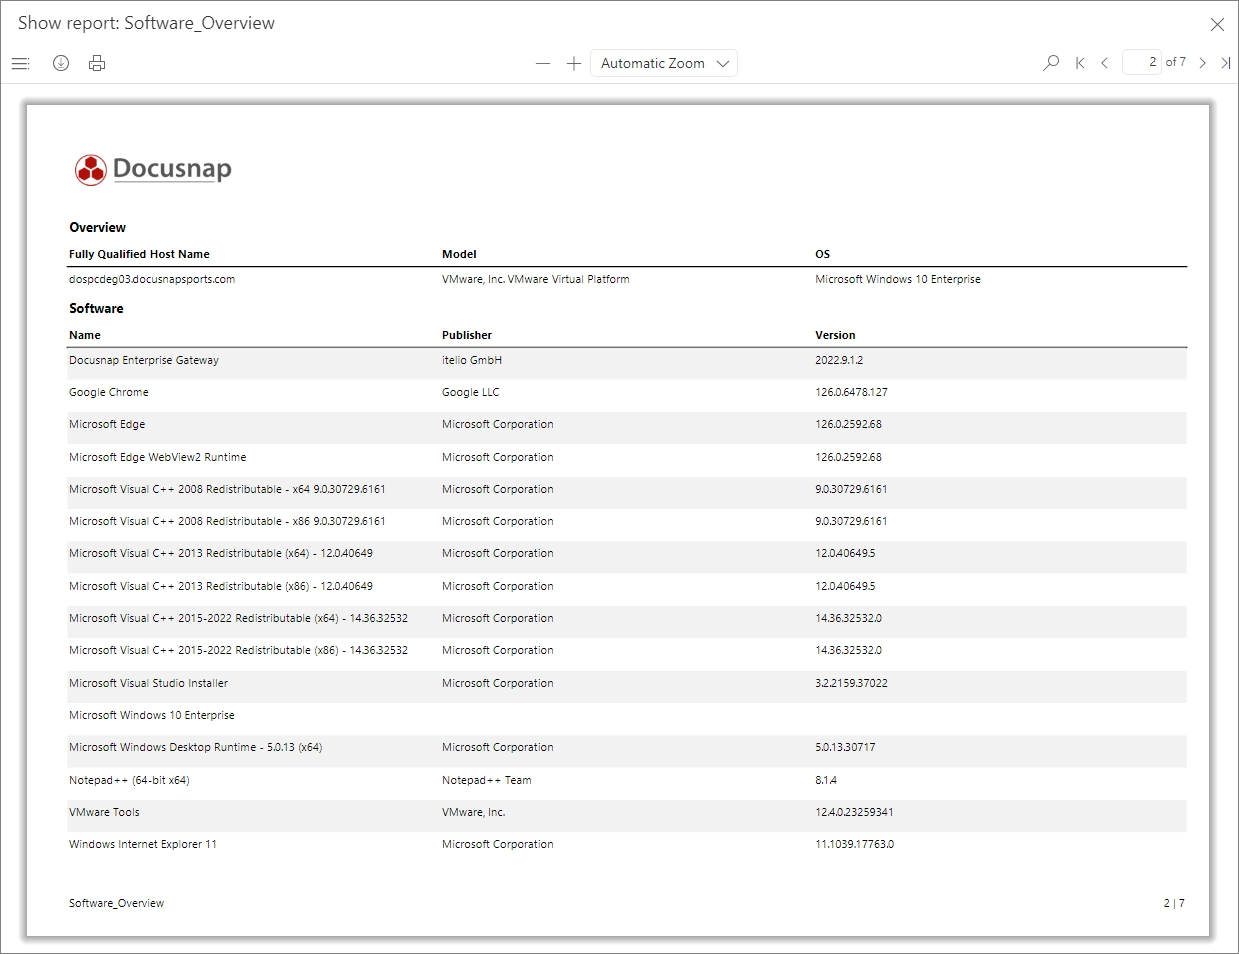
Here’s the translation:
title: “Relationships” linkTitle: “Relationships” weight: 300 type: docs description: >
Introduction
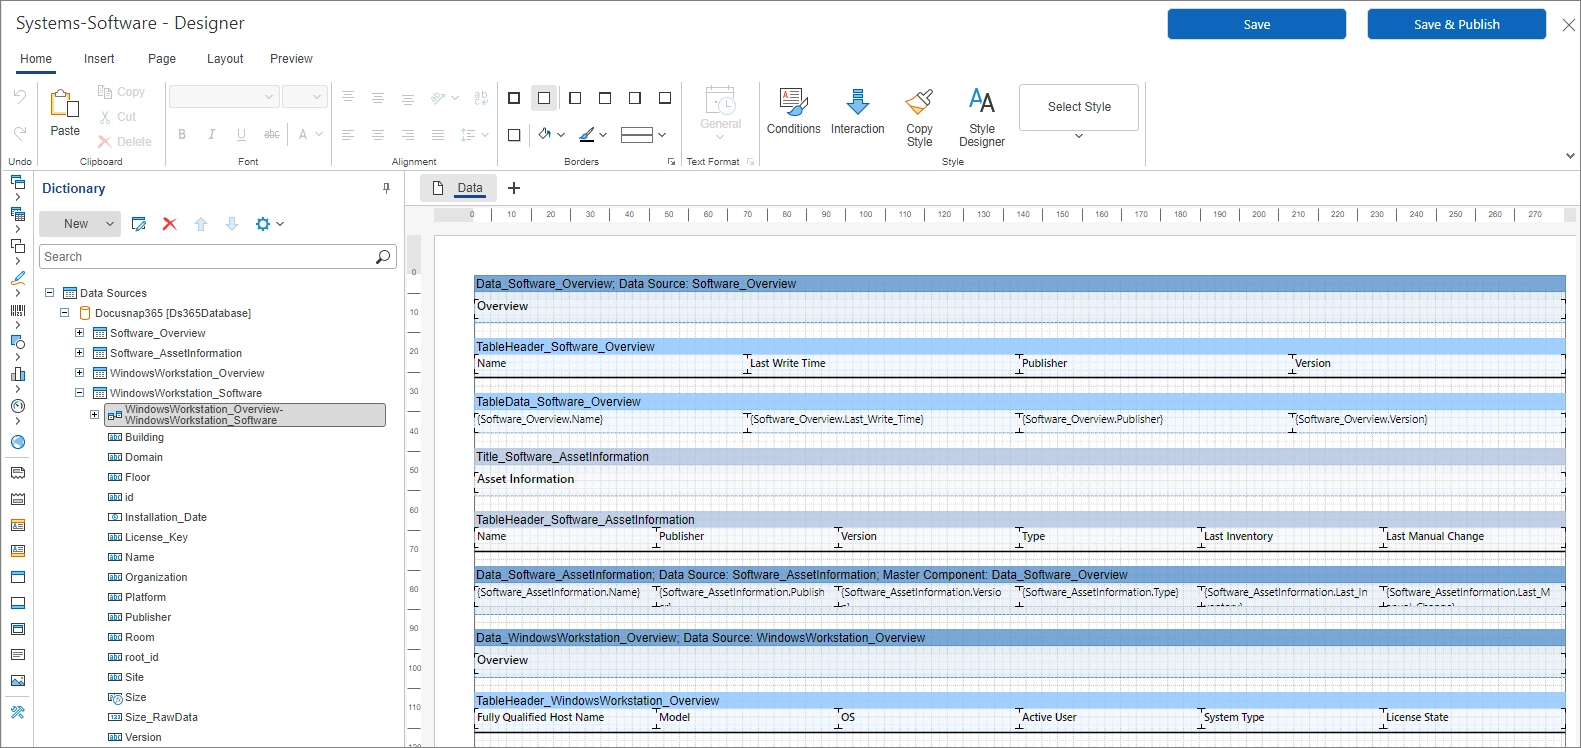
In reporting, relationships are used to define how information from different tables is related. Effective structuring of a report requires a clear distinction between parent and subordinate data, organized according to the defined characteristics and hierarchy levels of the data source. The tables created and their relationships are displayed in the “Data Sources” section of the report designer. Under each table name, the relationships are listed, always running from the subordinate to the parent table. For example, the connection “WindowsWorkstation_Overview-WindowsWorkstation_Software” under the table “WindowsWorkstation_Software”, where the separator “-” distinguishes the parent from the subordinate table.
Automatic Relationship Creation
In Docusnap365, relationships for reporting are automatically created during the data source definition if they can be derived from the defined hierarchy. In the example mentioned above, information from the “Overview” (fully qualified hostname and model) and from the “Software” category (name, publisher, license key) are considered. After defining the data sources, the tables “WindowsWorkstation_Overview” and “WindowsWorkstation_Software” are created. The relationship between these two tables (“WindowsWorkstation_Overview-WindowsWorkstation_Software”) is automatically created by Docusnap365 as it can be derived from the hierarchy. This relationship is listed in the report designer under the table “WindowsWorkstation_Software” and is named “WindowsWorkstation_Overview-WindowsWorkstation_Software”.

Manually Creating a Relationship
Docusnap365 can automatically create relationships in the previously mentioned examples. However, the following example shows why sometimes manual relationship creation is necessary: For a report where software is listed at the top and all workstations on which it is installed are listed below, a data source must first be created that contains all the necessary information.
Create Data Source
- Navigate to the “Data Sources” configuration area via the gear icon in the upper right corner.
- Start the wizard for creating the data source by clicking “New”:
- Select segments:
- “Software”
- “Systems”
- Set object type:
- “Windows Workstation” from the Systems segment
- “Software” from the Software segment
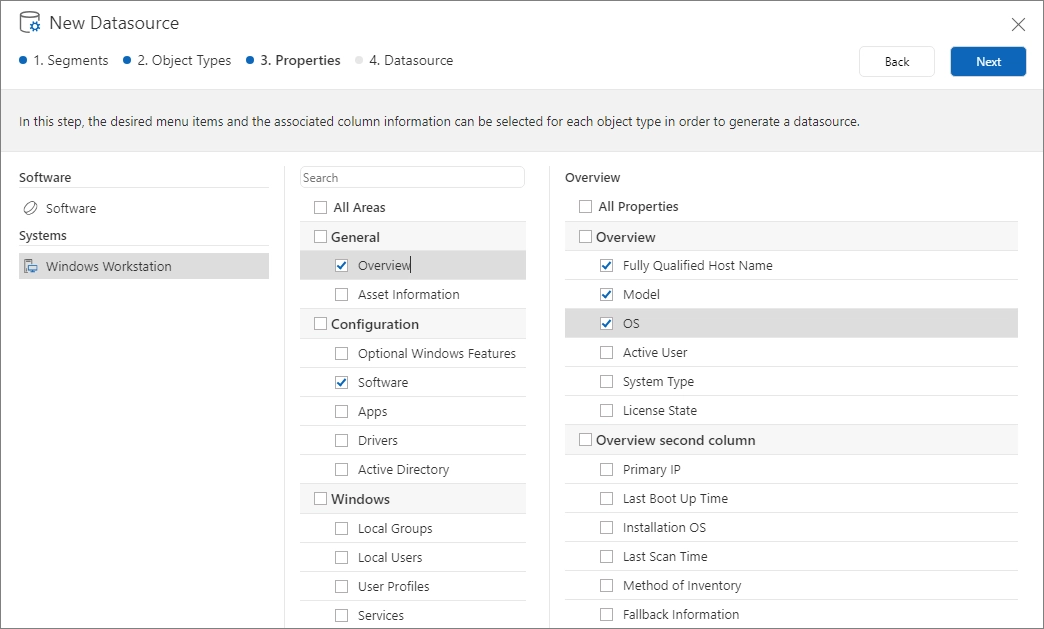
- Select properties:
- Software Overview area: Name, publisher, version
- Windows Workstation Overview area: Fully qualified hostname, model, OS Software area: Name, publisher, license key, version
- Select segments:
- Enter data source name: “Software Overview”
- Save data source
Create Report
- Navigate to the “Reports” configuration area via the gear icon in the upper right corner.
- Start the dialog to create a report by clicking “New”:
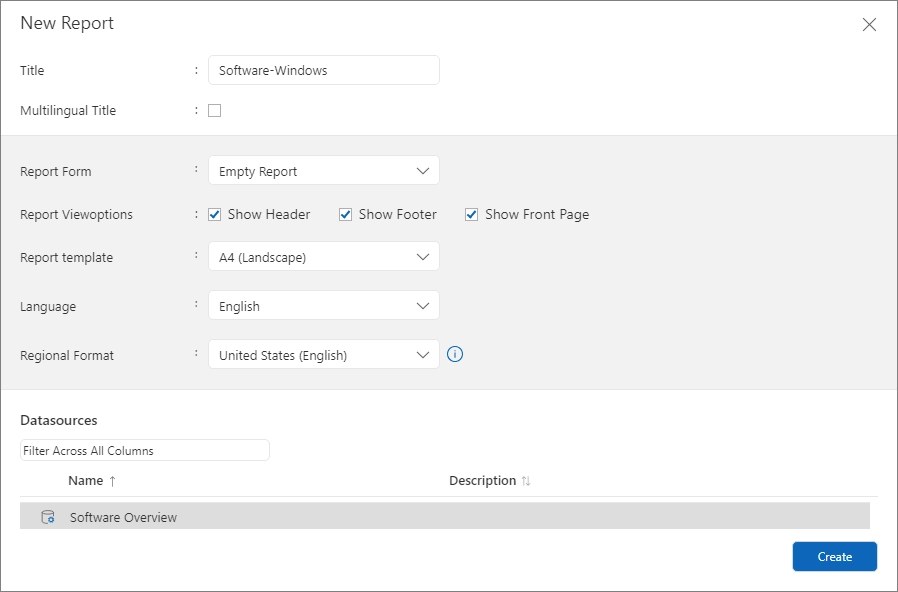
- Title: “Software-Windows”, appears on the cover page.
- Report form: Select “Empty Report”.
- Report template: A4 in landscape format.
- Report display options, language, and regional format: Retain the default settings.
- Data Source: Select the previously created data source “Software Overview”.
Customize Report
Manually Create a Relationship
Once the data source and the empty report are prepared, the report can be opened in the report designer. In the dictionary under “Docusnap365”, four tables are listed:
- WindowsWorkstation_Overview: Contains information such as fully qualified hostname, model, and operating system.
- WindowsWorkstation_Software: Contains data such as name, publisher, license key, and version.
- Software_Overview: Lists the name, publisher, and version of all software products in the organization.
Underneath the table WindowsWorkstation_Software, the automatically created relationship between WindowsWorkstation_Overview and WindowsWorkstation_Software is displayed. This relationship arises from the common object type affiliation of both tables, as both relate to Windows workstations.
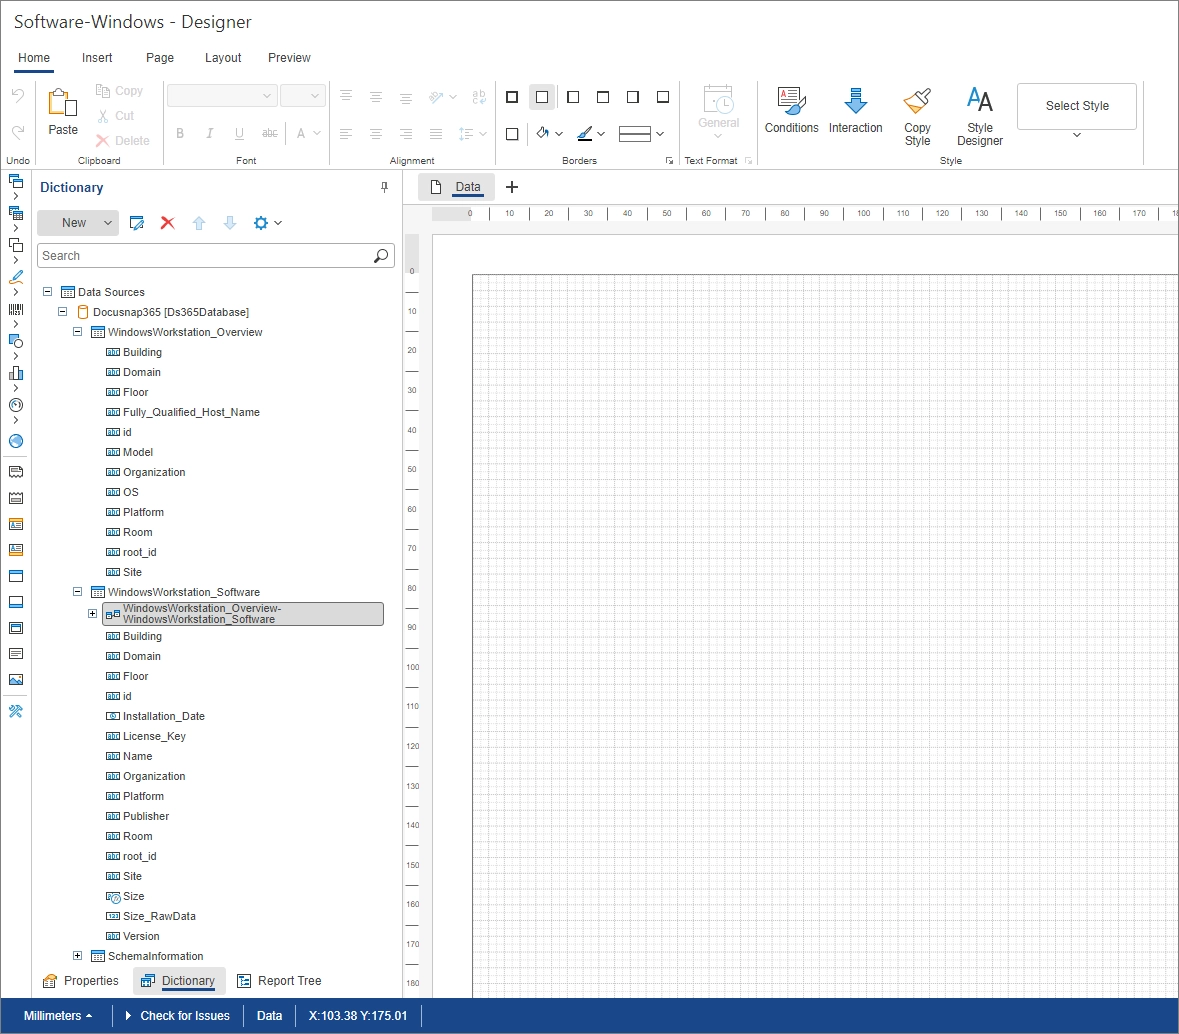
For a report that shows software on the top level and the systems on which it is installed below, a manual relationship between the tables Software_Overview and WindowsWorkstation_Software is
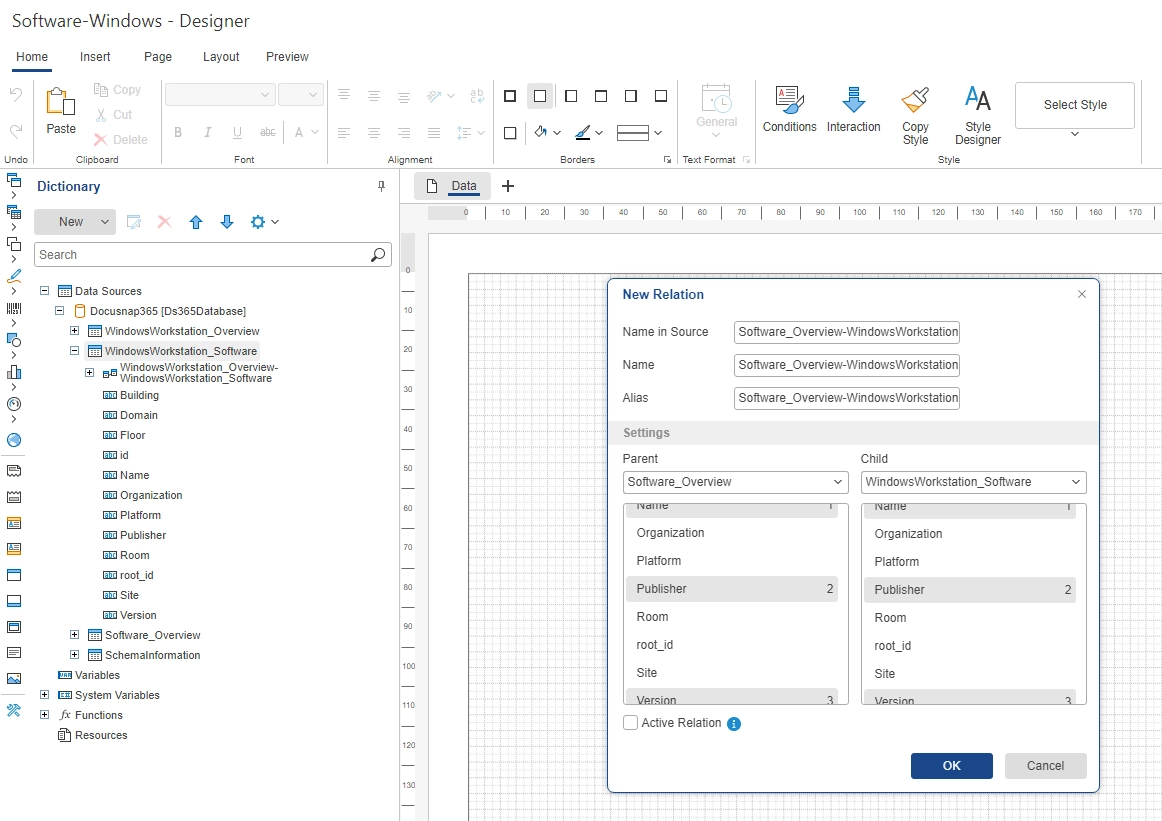
necessary. Since these tables represent different object types, the relationship cannot be automatically established. To check whether a software from the overall list is installed on a system, the properties software name, publisher, and version are used. Based on these criteria, a match is checked at runtime; if a match exists, the corresponding system is displayed below. Details on configuring the report structure can be found in the chapter Set Report Structure. The following settings must be made to create the report in the desired form:
- Open the dialog to create the relationship via the context menu of the table WindowsWorkstation_Software and the “New Relationship” button.
- Enter the name in the data source, name, and alias name as Software_Overview-WindowsWorkstation_Software.
- Select Software_Overview from the dropdown menu for “Parent”.
- Select WindowsWorkstation_Software from the dropdown menu for “Subordinate”.
- Set the properties that define the relationship:
- 1st Criterion: Name
- Search and select the property “Name” in the parent table, marked as 1.
- Search and select the property “Name” in the subordinate table, also marked as 1.
- 2nd Criterion: Publisher
- With the control key (CTRL) pressed, search and select the property “Publisher” in the parent table, marked as 2.
- Also search and select the property “Publisher” in the subordinate table with the control key (CTRL) pressed, also marked as 2.
- 3rd Criterion: Version
- With the control key (CTRL) pressed, search and select the property “Version” in the parent table, marked as 3.
- Also search and select the property “Version” in the subordinate table with the control key (CTRL) pressed, also marked as 3.
- 1st Criterion: Name
After saving, the relationship “Software_Overview-WindowsWorkstation_Software” is visible below the table “WindowsWorkstation_Software”.
Build Report
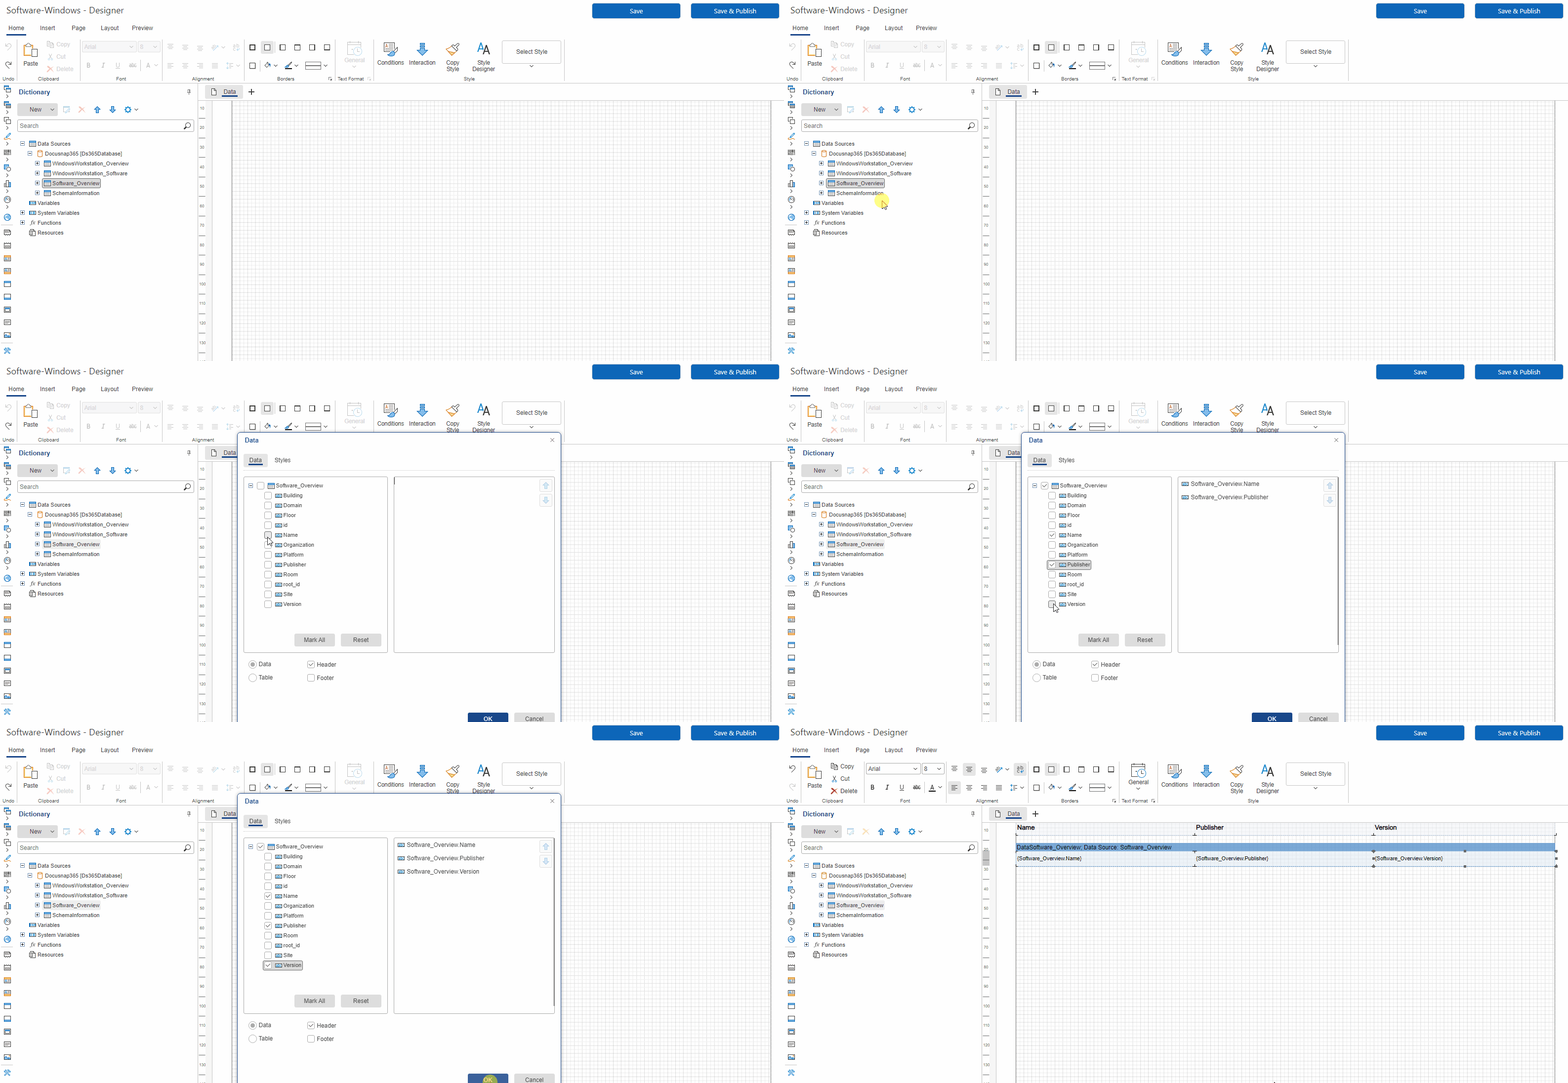
Create Parent Level
- Drag and drop the “Software_Overview” table into the workspace. A dialog to select the properties for the top level opens: “Name”, “Publisher”, and “Version”.
- Activate the “Data Head” checkbox to receive headings. Confirm with “Ok”, after which a “Data Head” and a “Data Band” are inserted into the workspace.
Create Subordinate Level
- Drag and drop the “WindowsWorkstation_Software” table into the workspace. To select the properties of the systems, expand the relationship “WindowsWorkstation_Overview-WindowsWorkstation_Software” and select the properties “Fully_Qualified_Host_Name”, “Model”, and “OS”.
- Do not activate the checkbox for the “Data Head” to avoid unnecessarily inflating the report with headings. After confirming with “Ok”, a “Data Band” with the selected properties is inserted into the workspace.
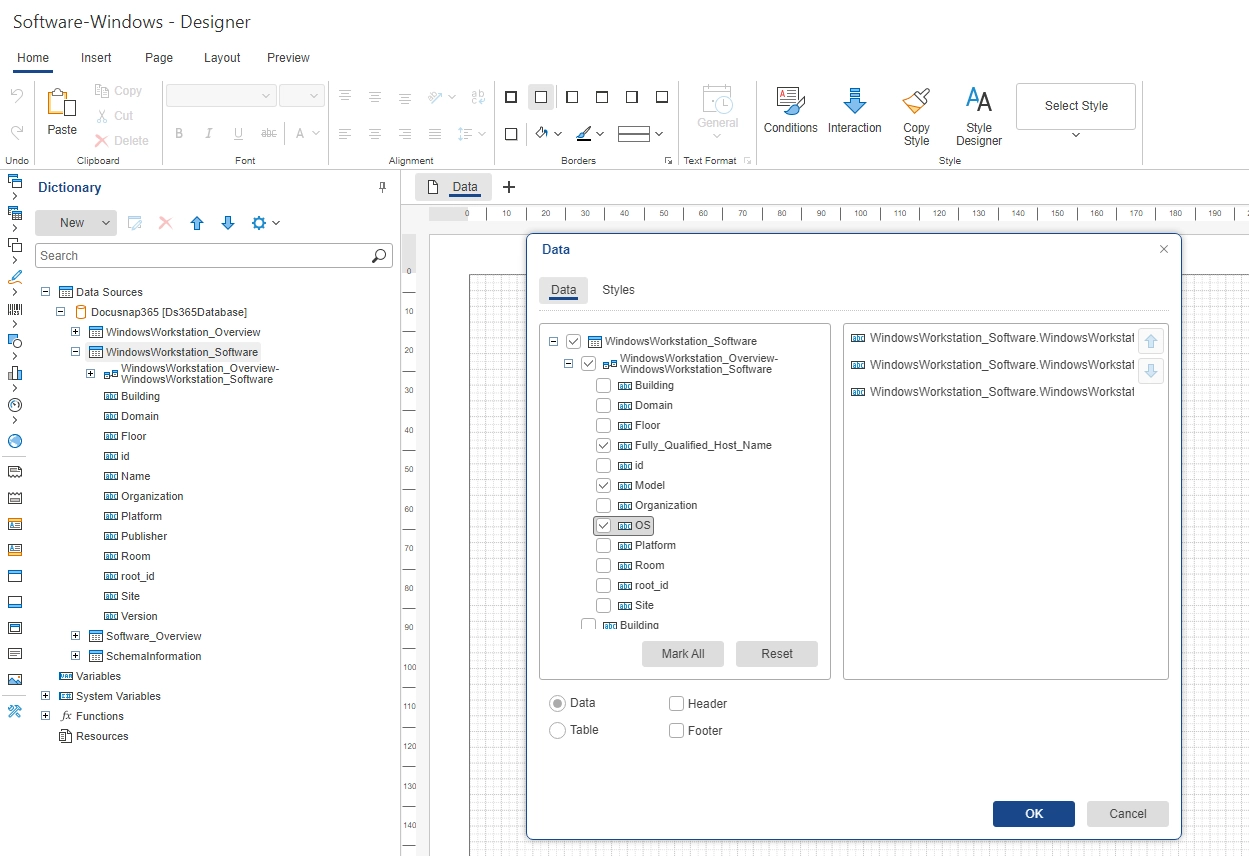
The report in this form will first list all software products and then all systems. In the next step, these elements are connected by linking the lower data band with the upper data band.
Connect Subordinate Level
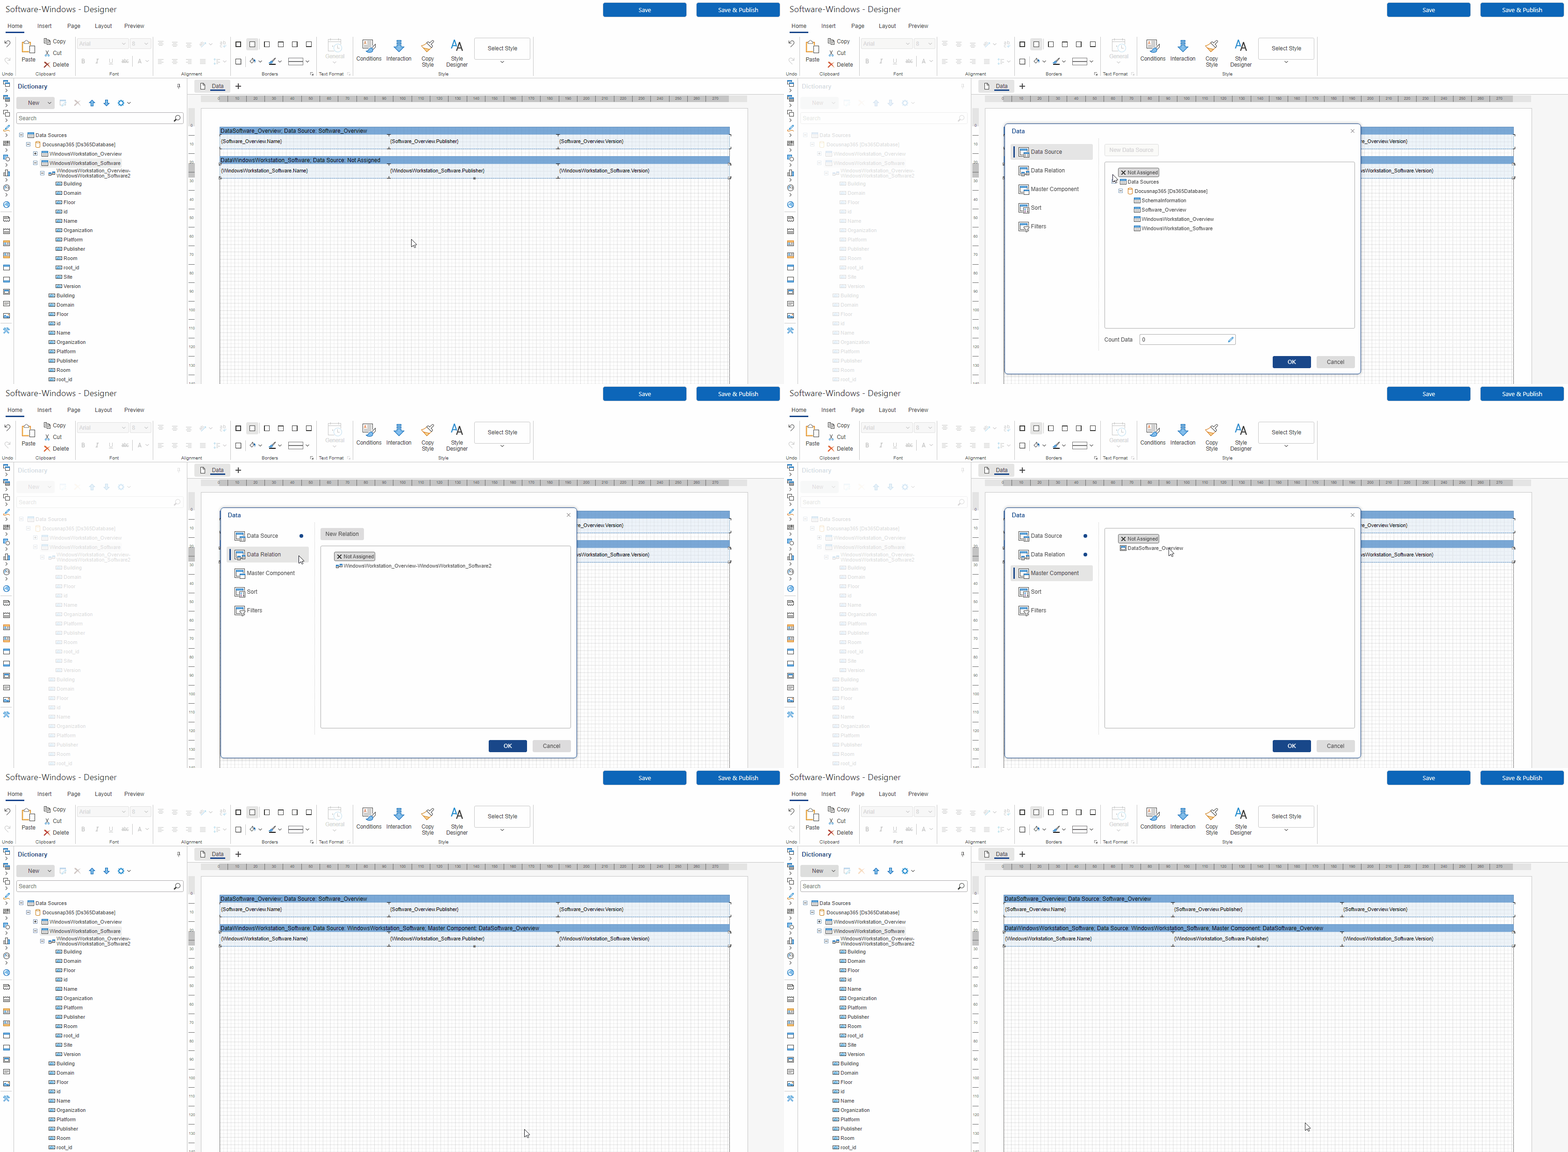
- Double-click the lower data band “DataWindowsWorkstation_Software; …” to open the settings.
- In the appearing dialog, adjust the menu items data source, relationship, and main component:
- Data Source: Select “WindowsWorkstation_Software”.
- Relationship: Select “Software_Overview-WindowsWorkstation_Software”.
- Main Component: Select the parent data band “DataSoftware_Overview”.
- Click “Ok” to apply the settings.
To make the system information more clear, slightly move the first field in the lower data band to the right by dragging and dropping.
After clicking “Save and Generate”, the report is generated according to the configuration. After completion, it can be called up for preview via the context menu.
