Tables and Properties
less than a minute
Introduction
After defining a data source, the data relevant to the report are extracted from the original data and stored in separate tables. This process aims to efficiently isolate only the necessary information, significantly improving performance and resource consumption during report creation.
Tables
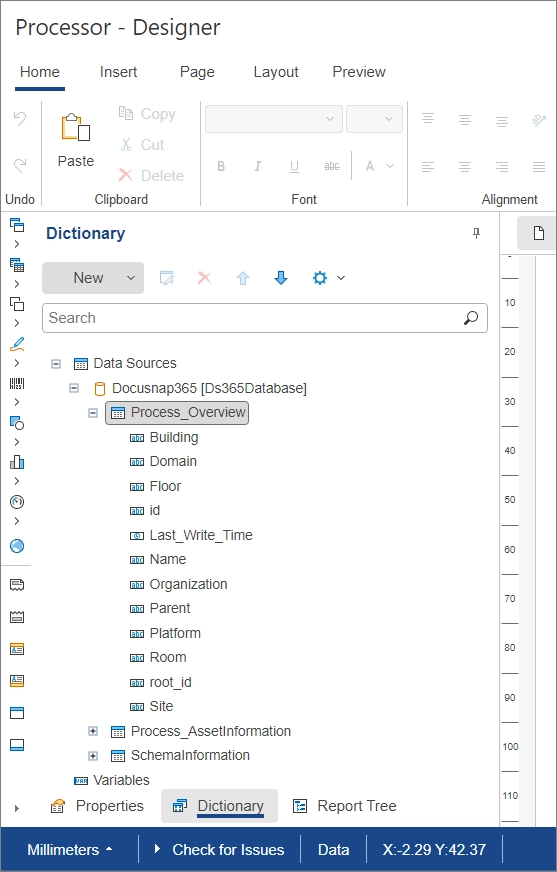
In the report designer, the tables created according to the selected data source “Docusnap365” are listed under the “Dictionary” tab in the information area. The table names reflect the source of the information. For example, a table that displays the properties of Windows workstations from an overview is labeled “WindowsWorkstation_Overview”.
To display the contents of a table, the “Show Data” button can be clicked in the context menu of the relevant table. This action opens a new tab in the browser, showing the data in tabular form. Only a limited number of data is displayed to prevent the report creation process from being overwhelmed by large volumes of data.
Detailed information about tables and their properties can be found in the guide to Data Sources, specifically in the section Tables & Properties.
