Quick Start
7 minute read
Introduction
DocusnapSports GmbH plans to upgrade from Windows 10 to Windows 11 for all its IT equipment, including notebooks, desktop PCs, servers, printers, and network equipment. The IT department will conduct an initial compatibility check to determine which devices are compatible with the new operating system. Devices that do not meet the requirements will be replaced. In this initial phase, DocusnapSports GmbH focuses on reviewing processor information. A more comprehensive compatibility assessment that includes hard drive storage, RAM, TPM, and UEFI is not part of this guide. Additionally, a report on all Windows computers will be provided for accounting.
Requirements
For the specified use case, three reports are needed:
Tabular Report for Accounting: This report includes the fully qualified hostname, model, operating system name, and serial number.
Hierarchical Report on Computer and Processor Information: This report is organized into two levels. The first level displays the fully qualified hostname, model, operating system name, and serial number. The second level shows processor information such as name, manufacturer, and maximum clock frequency.
Tabular Report on Computer and Processor Information: This report lists the fully qualified hostname, operating system name, manufacturer, and maximum clock frequency in tabular form.
The first two reports utilize the functionality of automatic report generation in two different approaches. This method is time-efficient as it relies on predefined report structures and data integrations that allow for quick and effective report creation. The third report starts with a blank report, using a blank document as the basis for creating a table with system and processor information.
1. Tabular Report for Accounting
This report is created through automated report generation, which is defined in the data source definition.
Create Data Source
- Navigate to the “Data Sources” configuration area via the gear icon in the upper right corner.
- Click “New” to start the data source creation wizard:
- Select segment: “Hardware”
- Set object type: “Computer (Windows)”
- Select properties:
- Overview area: Fully Qualified Hostname, Model, Operating System Name, Serial Number
- Enter data source name: “ComputerOverview_Accounting”
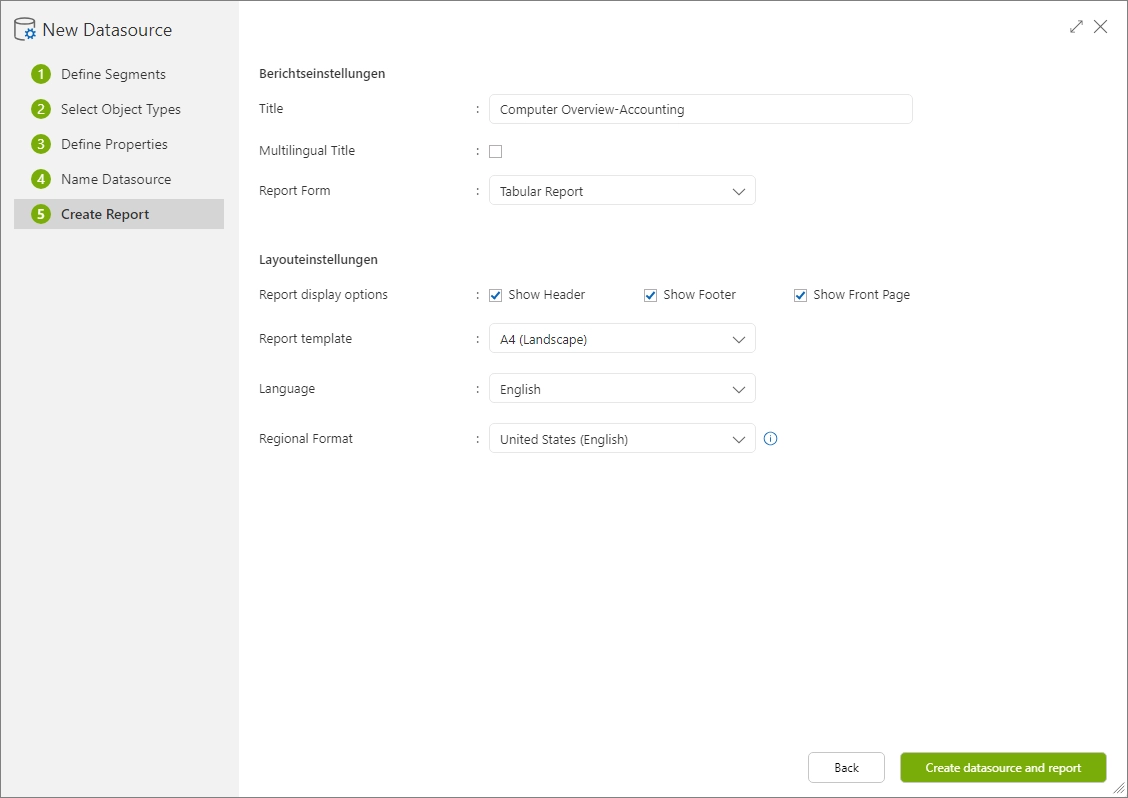
- Activate the option “Automatically generate report.”
- Set report title: “Computer Overview-Accounting”
- Choose report format: Tabular Report
- Select report template: A4 (Landscape)
After saving the data source, it and the associated report are automatically created. Upon completion, a notification appears in the notification center. The status of the data source is set to “Data is up-to-date,” and in the Reports section, the status reads “Report and Data are up-to-date.”
Display Report Preview
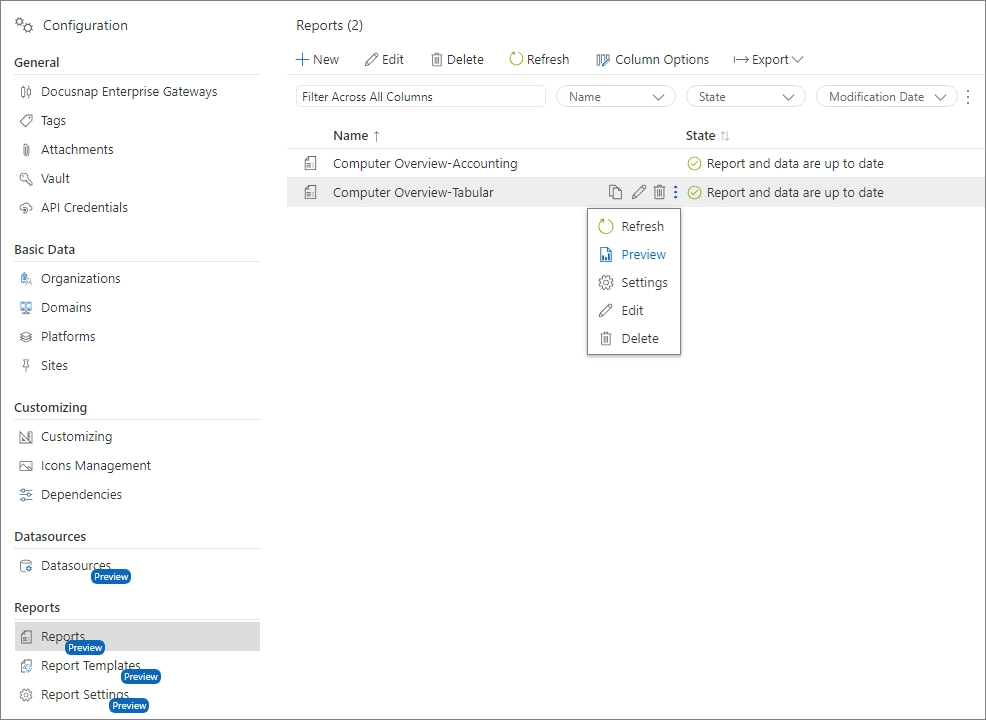
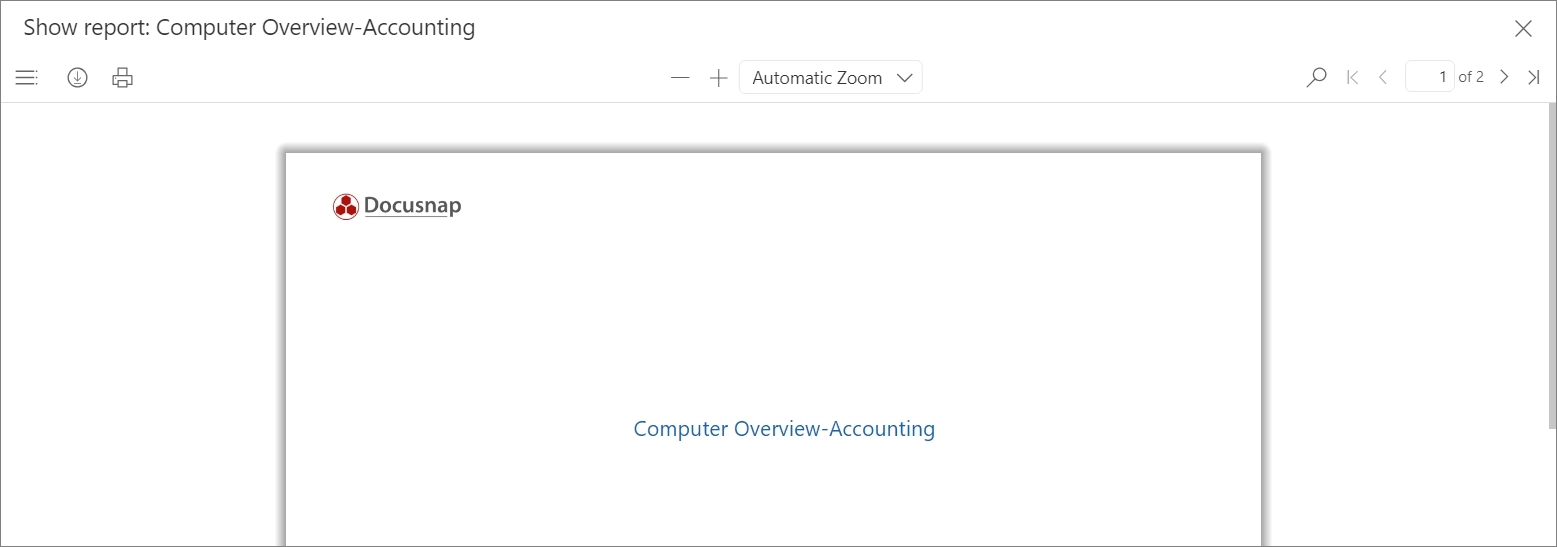
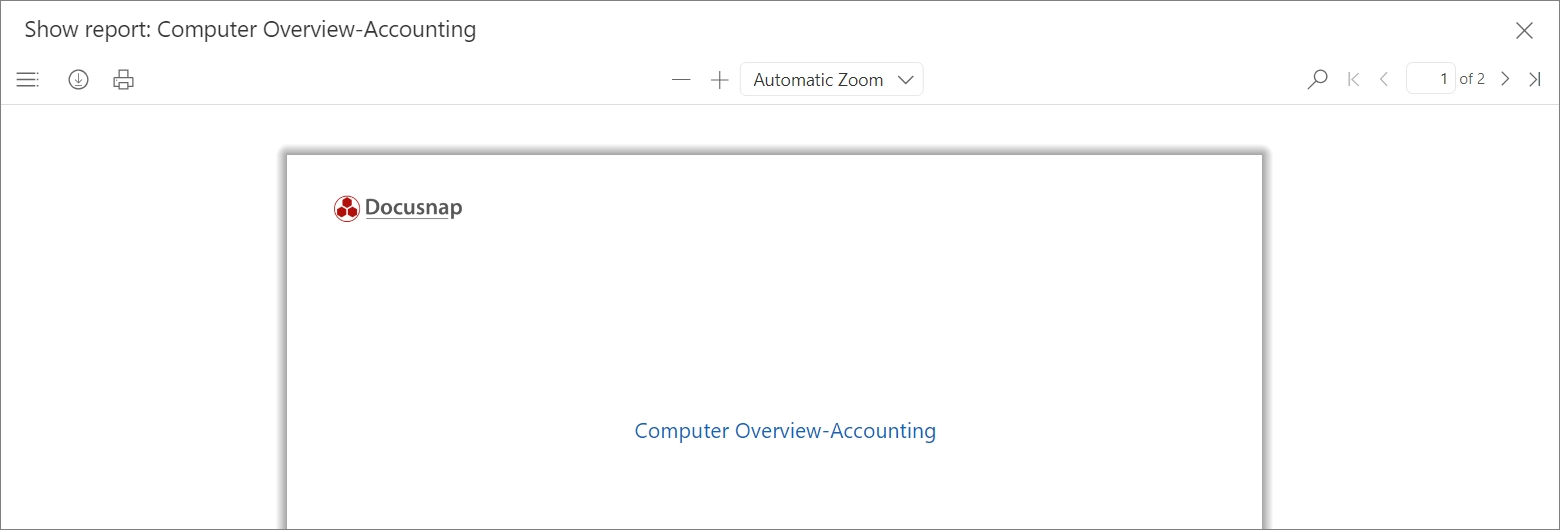
To view a preview of the report, navigate to the “Reports” section. There, the preview can be opened via the context menu for the report “Computer Overview-Accounting.”
2. Hierarchical Report on Computer and Processor Information
In the first report, the option “Automatically generate report” was selected in the last step of the data source wizard. The current report uses an alternative method of automatic report generation to demonstrate different ways of creating reports.
Create Data Source
- Navigate to the “Data Sources” configuration area via the gear icon in the upper right corner.
- Click “New” to start the data source creation wizard:
- Select segment: “Hardware”
- Set object type: “Computer (Windows)”
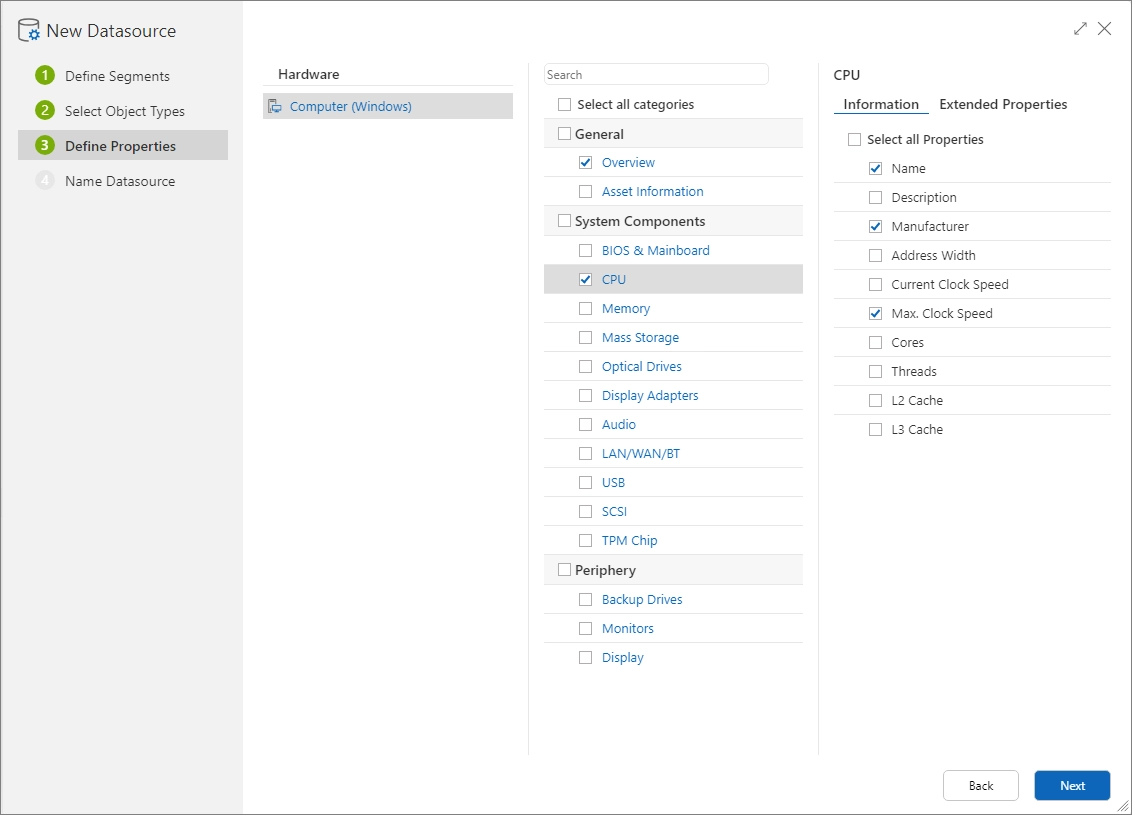
- Select properties:
- Overview area: Fully Qualified Hostname, Model, OS, and Serial Number
- Processor area: Name, Manufacturer, and Max. Clock Speed
- Enter data source name: “ComputerOverview_Hierarchical”
- Save data source
After saving the data source, it and the associated report are automatically created. Upon completion, a notification appears in the notification center. The status of the data source is set to “Data is up-to-date,” and in the Reports section, the status reads “Report and Data are up-to-date.”
Create Report
The hierarchical report form presents information according to the data hierarchy. In this case, hardware information such as the Fully Qualified Hostname, Model, Operating System Name, and Serial Number is displayed at the top level, while details on processors, such as Name, Manufacturer, and maximum clock frequency, follow at a subordinate level. This structure is particularly suited for data in a Parent-Child relationship.
To use the automatic report generation function, switch to the “Reports” area and open the report creation dialog via the “New” button.
The following settings should be made in the dialog for the new report:
- Title: “Computer Overview-Hierarchical,” appears on the cover page.
- Report Form: Select
“Hierarchical Report.”
- Report Template: A4 in landscape format.
- Report Display Options, Language, and Regional Format: Retain the default settings.
- Data Source: Select the previously created data source “ComputerOverview_Hierarchical.”
Report Preview
Once the report is saved, it is automatically filled with the selected data and secured in the background. The preview of the report can be accessed via the context menu by clicking on “Preview.” Additionally, it is always accessible in the “Documentation - Reports” section of the main menu.
3. Tabular Report on Computer and Processor Information
The creation of the third report follows the procedure of the second: First, a data source is created, then a new blank report is set up in the “Reports” section. Alternatively, the step of creating a data source can be skipped and built directly on the data source created for the second report (ComputerOverview_Hierarchical) since the same information is to be presented in a different report form.
Create Data Source
- Navigate to the “Data Sources” configuration area via the gear icon in the upper right corner.
- Click “New” to start the data source creation wizard:
- Select segment: “Hardware”
- Set object type: “Computer (Windows)”
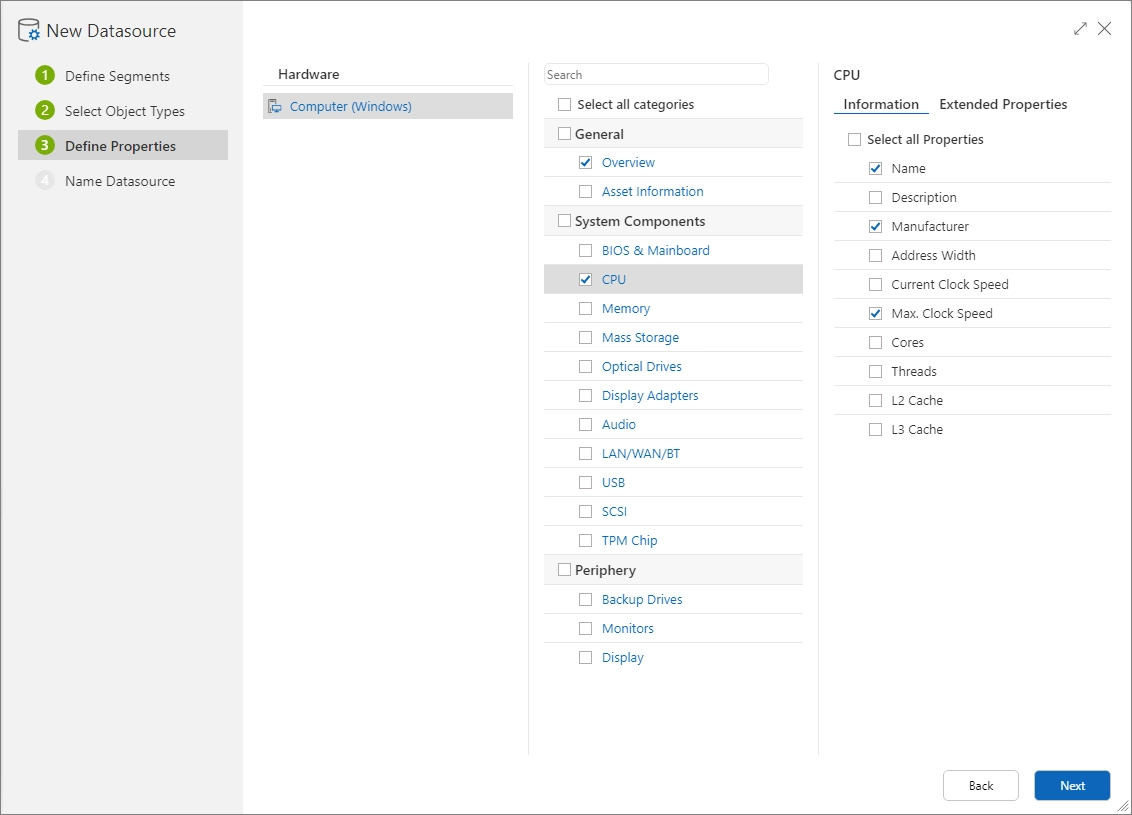
- Select properties:
- Overview area: Fully Qualified Hostname, Model, OS, and Serial Number
- Processor area: Name, Manufacturer, and Max. Clock Speed
- Enter data source name: “ComputerOverview_Tabular”
- Save data source
After saving the data source, the data for this data source are extracted, processed, and stored. Upon completion, a notification appears in the notification center. The status of the data source is set to “Data is up-to-date.”
Create Report
To create the blank report, switch to the “Reports” area and open the report creation dialog via the “New” button.
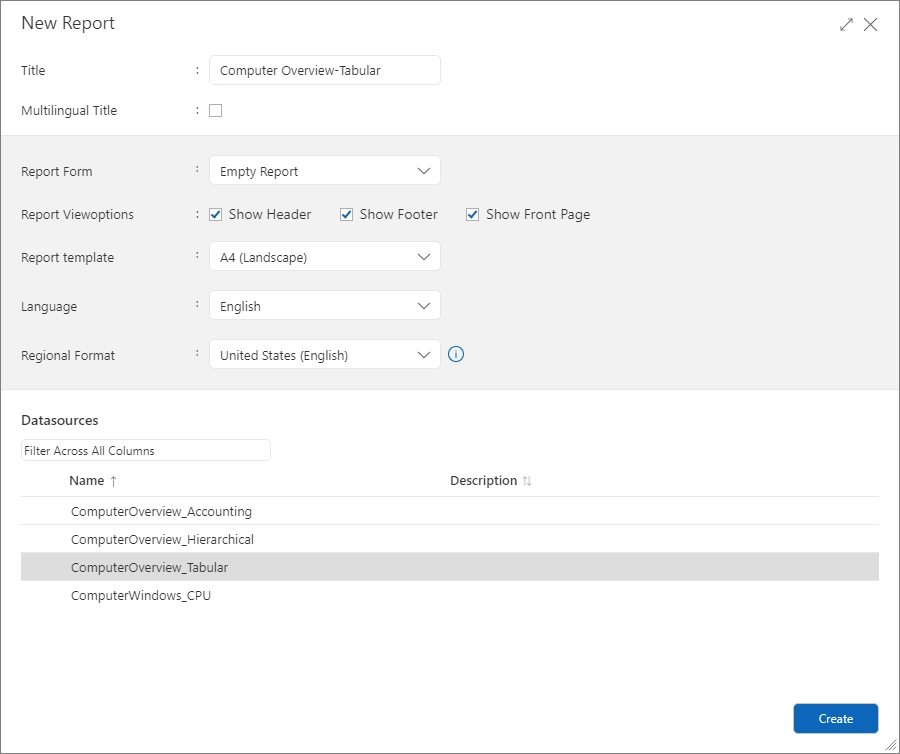
The following configurations should be made in the dialog for the new report:
- Title: “Computer Overview-Tabular,” displayed on the cover page.
- Report Form: Select “Empty Report.”
- Report Template: A4 Landscape, specially adapted for the use case.
- Report Display Options, Language, and Regional Format: Retain the standard options.
- Data Source: Select the data source “ComputerOverview_Tabular.” Alternatively, use the data source from the second example “ComputerOverview_Hierarchical.”
Report Designer
After creating the blank report, it can be customized by clicking “Edit” in the Report Designer. The Report Designer is divided into various areas:
- Ribbon: Here, the layout and font of the report can be adjusted. The “Preview” button can open the report preview.
- Toolbar: Provides components for report creation.
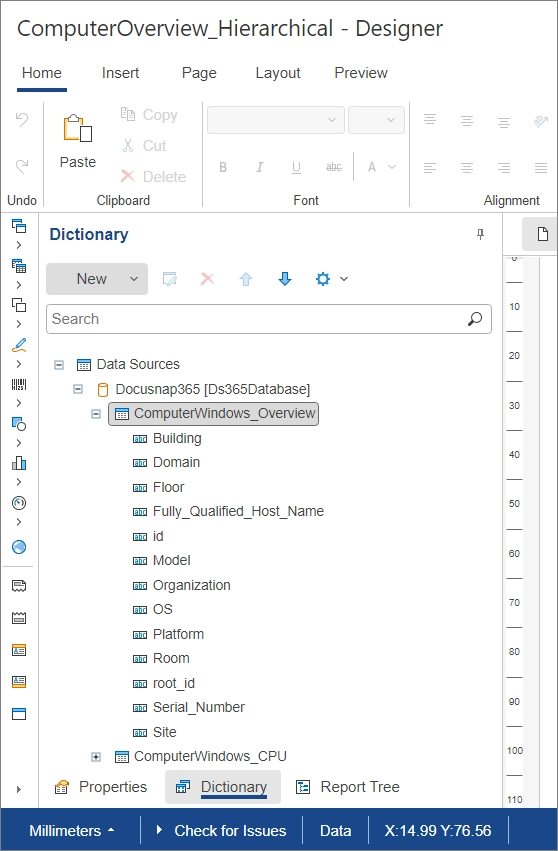
- Information Area: Contains a dictionary with the defined data sources.
- Workspace: Here, the data bands and desired information for the report are placed.
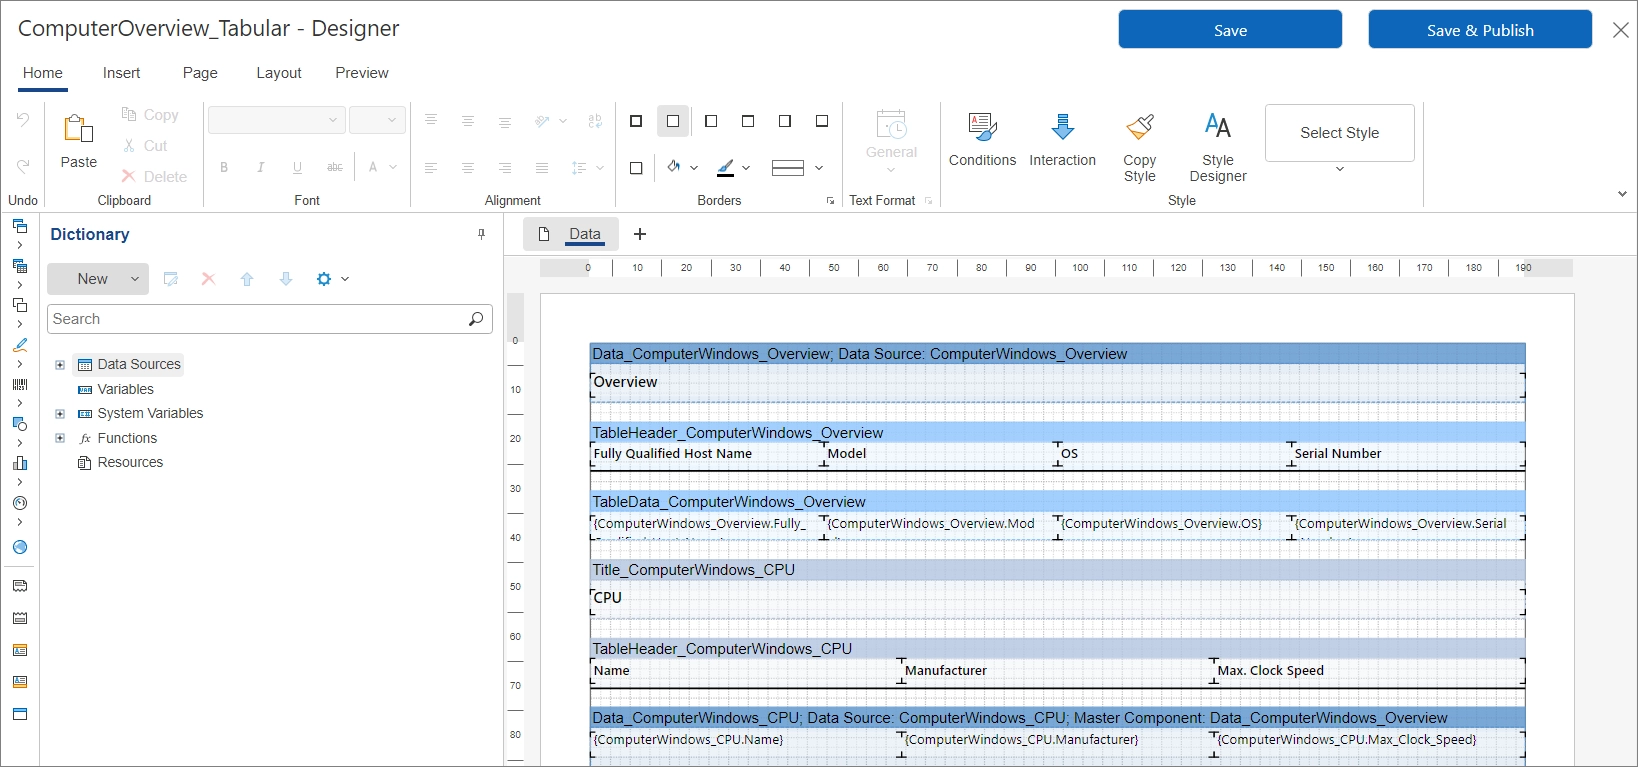
In the creation of the report, certain elements of the toolbar are particularly important, including the bands like the header band and the data band. The header band includes the headings of the respective sections, whereas the data band is used to display dynamic data that is repeated for each row of a dataset.
When expanding the data sources and the specific data source “Docusnap365,” the following tables from the previously created data source become visible:
- ComputerWindows_Overview: Contains properties Fully_Qualified_Hostname, Model, OS, and Serial_Number.
- ComputerWindows_CPU: Includes CPU information such as Name, Manufacturer, and maximum clock frequency.
The remaining properties are not relevant for this use case and are detailed in the subsequent sections.
Edit Report
The data source “ComputerOverview_Tabular” or “ComputerOverview_Hierarchical” is organized in a hierarchical structure, which poses a challenge for creating a tabular report. The hierarchy is defined by the relationship ComputerWindow_Overview-ComputerWindows_CPU.
Necessary steps to create the tabular report:
Select Table:
- Drag and drop the table “ComputerWindows_CPU” into the workspace.
- Dialog for selecting required properties opens.
Select Properties:
- Expand the relationship ComputerWindow_Overview-ComputerWindows_CPU.
- Select properties Fully_Qualified_Hostname, Model, OS, and Serial_Number for general system information.
- Select CPU-specific properties Name, Manufacturer, and Max_Clock_Speed from the table ComputerWindows_CPU.
Adjust the Order:
- The order of properties can be adjusted using the arrow keys.
Add Headings:
- Activate the “Data Head” checkbox to add headings in the header band.
Integration into the Workspace:
- After configuration and confirmation by clicking “OK,” the selected information is integrated into the workspace.
Preview
- The “Preview” button in the ribbon can display the report, using only limited data volumes.
The “Save” button merely secures the report, but does not fill it with the current data from the data source. “Save & Generate” secures the report and immediately starts generating the report.

Report Preview
The created reports can be displayed in the configuration area by clicking the “Preview” button in the context menu. In the main menu under “Documentation,” the reports can also be accessed.
